Know in minutes whether a project is worth it.
Calculus turns project ideas into reliable numbers. NPV, ROI, break-even and financing scenarios, before your team commits time and budget.
Most teams commit resources before they actually know whether a project is worth it.
Calculus answers that question before it’s too late.
Too many projects are still evaluated in Excel.
Teams rebuild the same model in Excel over and over. Formulas get adjusted, versions multiply and stakeholders lose track of the logic.
Repetitive model work
Teams rebuild similar cashflow models from scratch instead of getting straight to the analysis.
Errors and version chaos
Small formula changes quickly introduce errors. Multiple versions of the same calculation start to circulate.
Hard to follow
Stakeholders see the result but not the logic behind it. That slows down fast and confident decisions.
Stop rebuilding models. Start with real project analysis.
Everything you need for a well-founded project decision.
From the first cost estimate to the financing structure: Calculus maps the entire evaluation process in one clear structure.
Model revenue and costs
Input
One-time and recurring costs as well as revenue items are entered directly in the project view. No formulas needed.
NPV, ROI, margin and break-even
KPIs
All key profitability metrics are calculated automatically and visible immediately, including NPV project and NPV equity.
Compare financing scenarios
Financing
Equity and debt share, interest rate, term and loan type (annuity, repayment, bullet) are set directly. The effect on NPV, ROI and cashflow is visible immediately.
NPV trend and cashflow overview
Visualisation
The NPV curve over the project lifetime and the cumulative cashflow broken down by operating costs, revenues, repayment and interest are displayed as charts.
Record and compare actuals
Plan vs. actuals
Actual costs and revenues are entered in the table view. Budget vs. actual costs and the profit waterfall update automatically.
Export as CSV and Excel
Export
Cashflow tables and results can be exported as CSV or Excel, ready to use for reports, presentations and audits.
AI chat included
Query project data instead of searching for it.
The built-in AI chat reads your project data from Calculus and Planner and answers specific questions in plain language. No navigating menus, no manual exports.
- Retrieve KPIs for a project: NPV, ROI, break-even, cashflow
- Compare projects by key metrics
- Show plan vs. actuals variances at an aggregated level
- Retrieve budget data from the Planner
All the critical questions answered at a glance.
Calculus answers the most important project evaluation questions in seconds, not in complex Excel models.
Is the project worth it?
NPV and return are calculated immediately, showing whether the investment pays off before any resources are committed.
When is break-even reached?
The break-even month is determined automatically and marked visually in the NPV trend chart.
What is the ROI?
ROI and project margin are displayed clearly, even as assumptions about costs or revenue change.
What changes with financing?
The effect of debt on NPV, cashflow and return is visible immediately, without rebuilding the model.
All answers in one clear structure. No model building. No uncertainty.
Add debt financing without rebuilding the model.
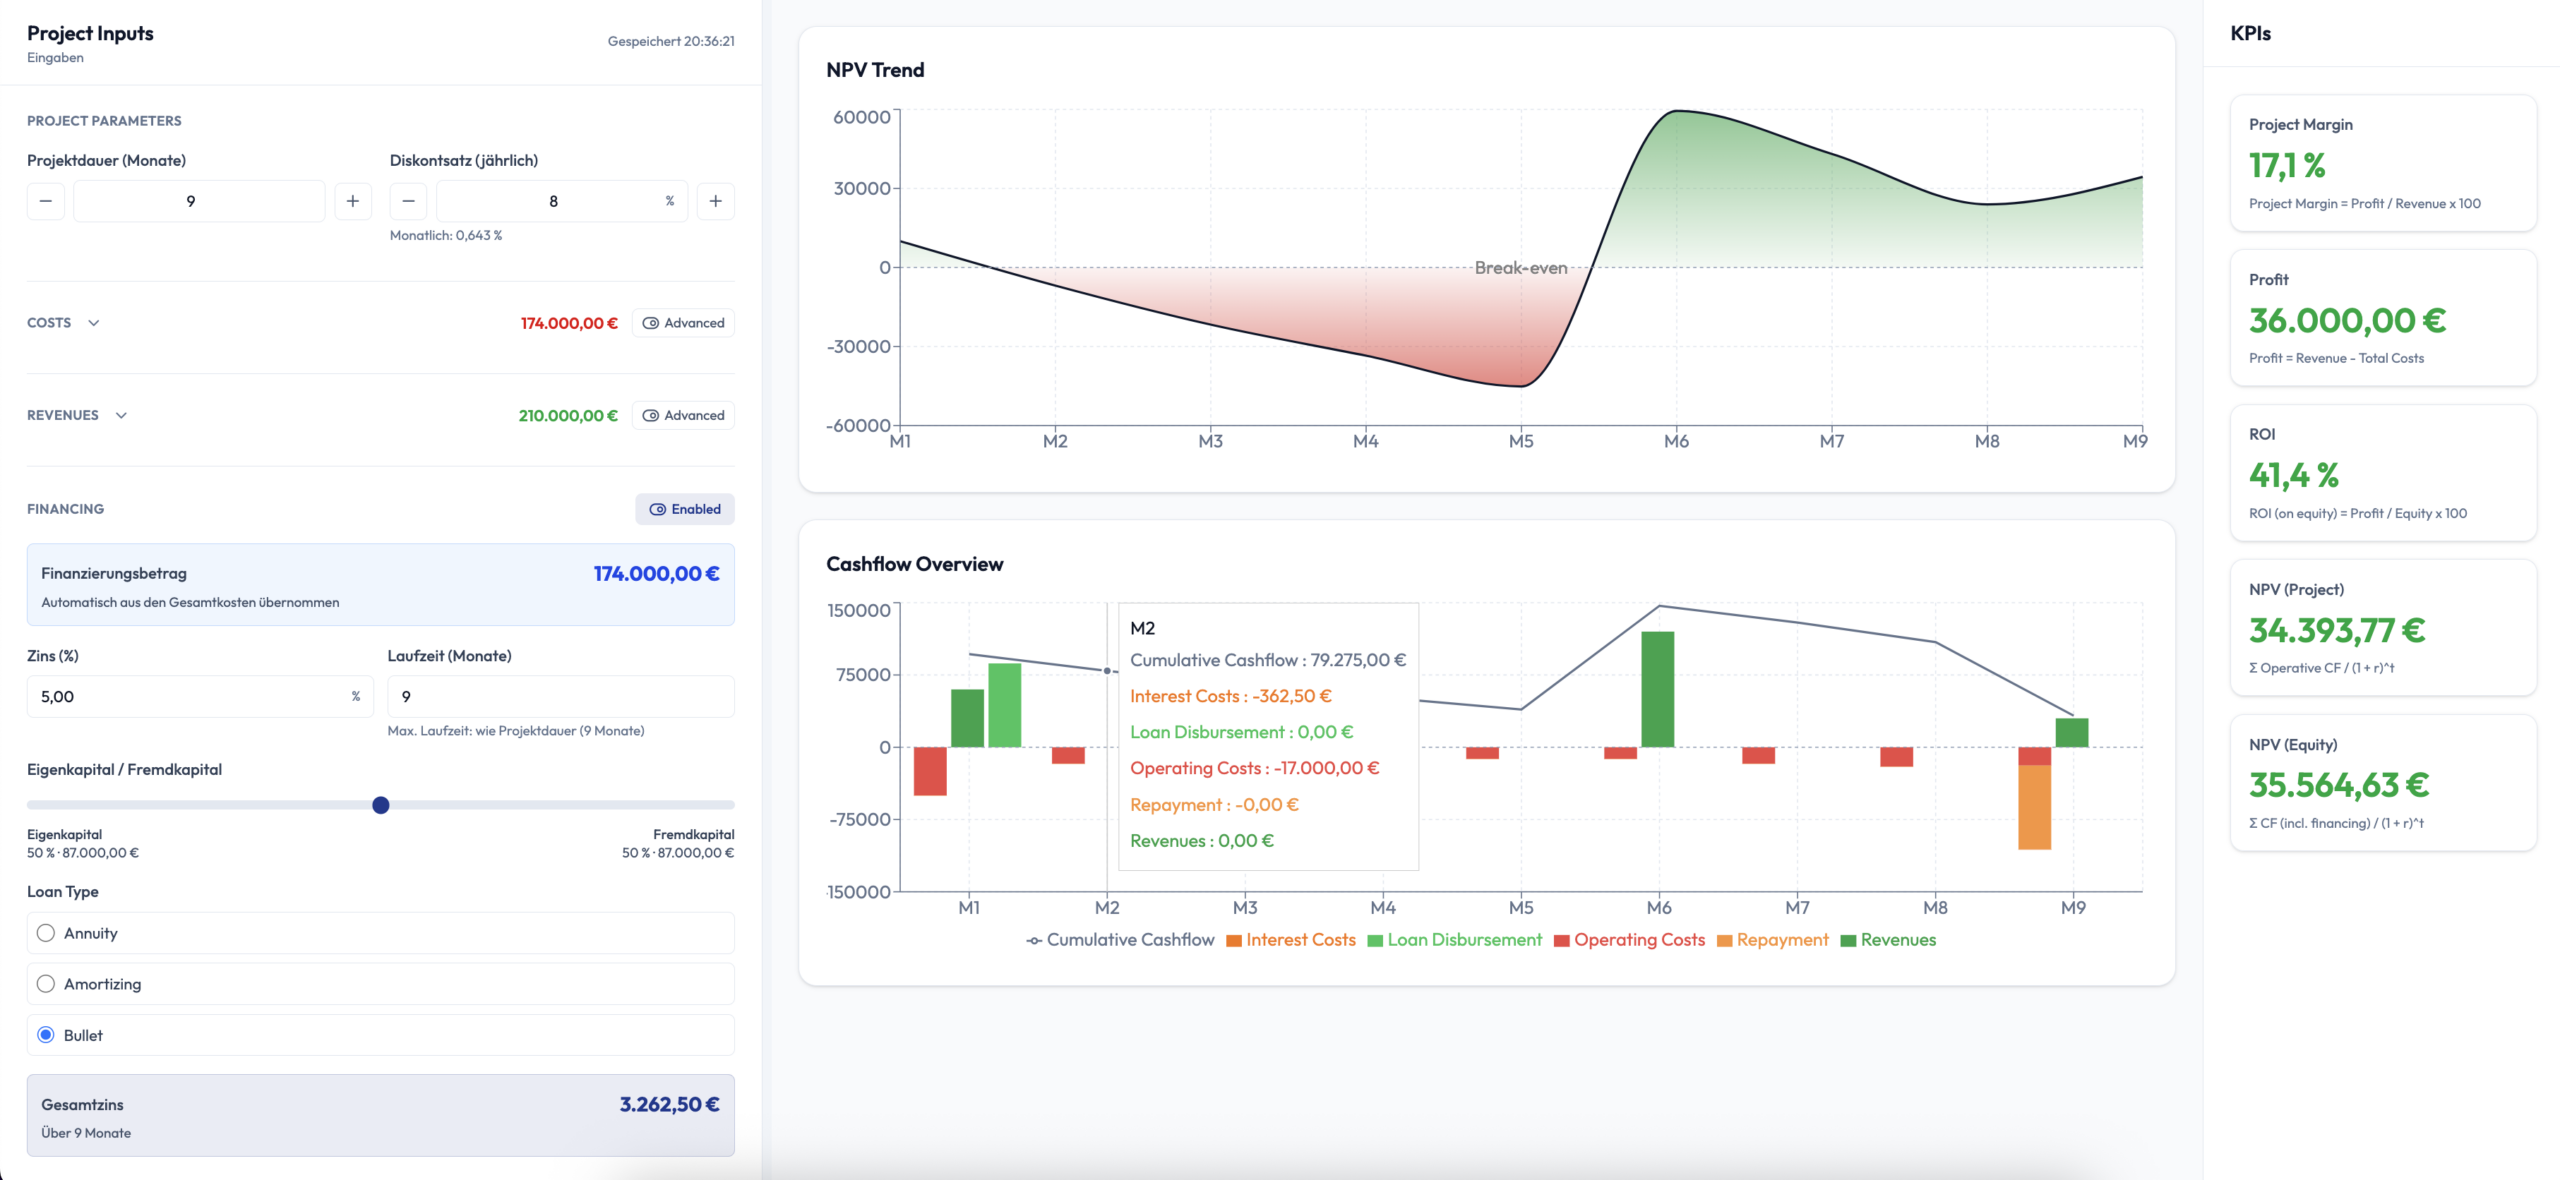
Calculus shows immediately how financing shares affect cashflow, NPV and return. Interest rate, term and loan type are adjustable directly.
From pure equity to realistic financing scenarios in one step.
Activate financing and see immediately how capital structure, returns and profitability change. The model stays stable and the analysis stays transparent.
NPV and return adjust immediately to new financing shares.
Cashflows stay consistent and do not need to be remodelled manually.
Annuity, repayment loan and bullet loan are directly comparable.
Financing goes from a modelling problem to a real analysis option.
Clear KPIs. Four charts. One view.
The analysis view brings all metrics and visualisations together on one screen, presentation-ready for finance teams and stakeholders.
NPV trend
Shows how the net present value develops over the project lifetime with the break-even point marked. Plan and actuals can be overlaid directly.
Cashflow overview
Monthly cashflow broken down by operating costs, revenues, loan disbursement, repayment and interest as a bar chart with cumulative line.
Profit waterfall
From revenue through all cost positions down to profit, every step traceable and easy to explain to stakeholders.
Budget vs. actual costs
Planned and actual costs are shown side by side each month. Variances are immediately visible and filterable by category.
For the decisions that really matter.
Calculus supports teams wherever project decisions need to be made quickly, reliably and transparently.
Before project start
Go or no-go
Validate quickly whether a project is worth pursuing before resources, budget or time are committed.
Financing decision
Equity vs. debt
Compare financing scenarios and see immediately how capital structure and profitability change.
Ongoing project
Plan vs. actuals monitoring
Enter actuals and track how the project develops against the plan, monthly and at category level.
Less modelling. Faster decisions. More confidence in the evaluation.
Why teams switch from Excel to Calculus.
The difference is not just in the design, but in speed, reliability and clarity for every project decision.
Excel forces teams to build models. Calculus gets teams to decisions faster.
Frequently asked questions about Calculus.
The most important answers for teams that want to evaluate projects faster and with more confidence.
What kinds of projects is Calculus suited for?
Calculus is suited for investment decisions, profitability analyses, financing comparisons and internal project evaluations, wherever you need to know whether a project is worth it before you start.
Can I compare financing scenarios?
Yes. You can adjust equity and debt shares directly and choose between annuity loan, repayment loan and bullet loan. NPV, ROI and break-even update immediately.
What does the AI chat do?
The built-in AI chat reads your project data from Calculus and Planner and answers specific questions in plain language. You can ask for KPIs like NPV, ROI or break-even, compare projects by metrics or retrieve plan vs. actuals variances, directly in the chat without navigating manually.
Do I need to build a complex model first?
No. Calculus is designed to map project evaluations in a structured way, without teams having to build a new Excel model every time. Costs and revenues are entered directly and the rest is calculated automatically.
Is Calculus suitable for presentations?
Yes. KPIs, charts and cashflow tables are structured so they can be shared directly with stakeholders. A CSV and Excel export is available for external reports.
Project evaluation that actually works.
Register for free and get started right away. No subscription, no credit card, no risk.
Or book a short call if you have questions first.